Beginner

Data Analytics with Jane (3.0)
Popular choice

The complete data analytics course you need to transition into a high-paying tech role.
Over the course of 30 weeks, we will cover:
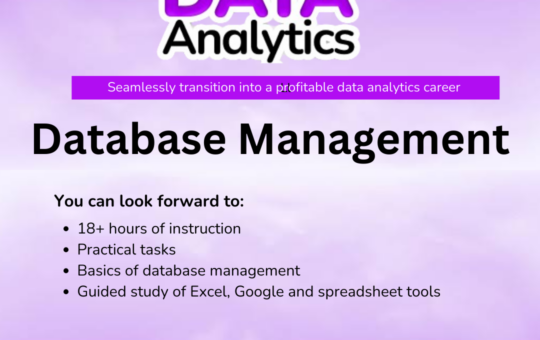
- Database management and spreadsheets (Google spreadsheets, Microsoft Excel)
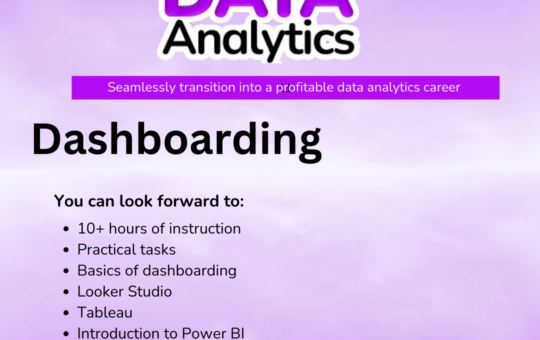
- Dashboarding (Looker Studio, Tableau, Power BI)
- Data wrangling and programming languages (R, SQL, Python)
- Documentation and presentation (report writing, presentations, team work)
- Career positioning (portfolios, resumes, applications)
We then transition into 4 months of guided practicals, projects and portfolio building as you handle applications and search for suitable roles to launch you into your desired career
This group coaching program features:
- Practical tasks
- Paid tools
- Guided portfolio building
- Career coaching
- Integrated job search
- 9 months of community access, mentorship and support
- 1 year access to the live class replays
Curriculum
- 8 Sections
- 19 Lessons
- 75h 23m Duration
Week 1 - Introduction
1 Lesson
- 1 - Data literacy
Week 2 - Spreadsheets
2 Lessons
- 1 - What can a spreadsheet do?
- 2 - Solving a business case
Week 3 - Spreadsheets
3 Lessons
- 1 - Basic table and charts interpretation
- 2 - Basic table and charts interpretation (part 2)
- 3 - Simple functions and references
Week 4 - Spreadsheets
4 Lessons
- 1 - Basic queries in Excel
- 2 - Basic queries in Excel (part 2)
- 3 - Data visualisation
- 4 - Data visualisation (part 2)
Week 5 - Spreadsheets
2 Lessons
- 1 - Assignment 1
- 2 - Data cleaning and rudimentary dashboards in Excel
Week 6 - Spreadsheets
2 Lessons
- 1 - Career Coaching (Imposter Syndrome)
- 2 - Career Coaching (Before you start your job search)
Week 7 - Spreadsheets
2 Lessons
- 1 - EC 1 review
- 2 - Mini project (part 1)
Week 8 - Spreadsheets
3 Lessons
- 1 - Basic statistics concepts (part 1)
- 2 - Basic statistics concepts (part 2a)
- 3 - Basic statistics concepts (part 2b)
Related Courses
Intermediate

Beginner
PKH DA - Database management and Spreadsheets
- Microsoft Excel
- Google sheets
- Spreadsheet tools
22h 48m
0
0
15